In today’s digital landscape, enterprises operate across hybrid infrastructure — on-prem data centers, multi-cloud platforms, Kubernetes clusters, SaaS services, APIs, and distributed applications.
Monitoring is no longer just about checking server uptime.
It is about:
- Ensuring business continuity
- Protecting customer experience
- Reducing operational noise
- Improving MTTR (Mean Time To Resolution)
- Aligning reliability with business SLAs
This guide presents a complete, modern monitoring and observability architecture used by large-scale organizations worldwide.
1️⃣ Start with Telemetry Standardization
Before choosing tools, enterprises standardize how telemetry is generated and collected.
Industry Standard: OpenTelemetry
OpenTelemetry provides a vendor-neutral way to collect:
- Metrics
- Logs
- Traces
Why Standardization Matters
- Avoid vendor lock-in
- Enable tool flexibility
- Support hybrid & multi-cloud
- Ensure consistency across teams
Modern architecture pattern:
Application → OpenTelemetry → Observability Platform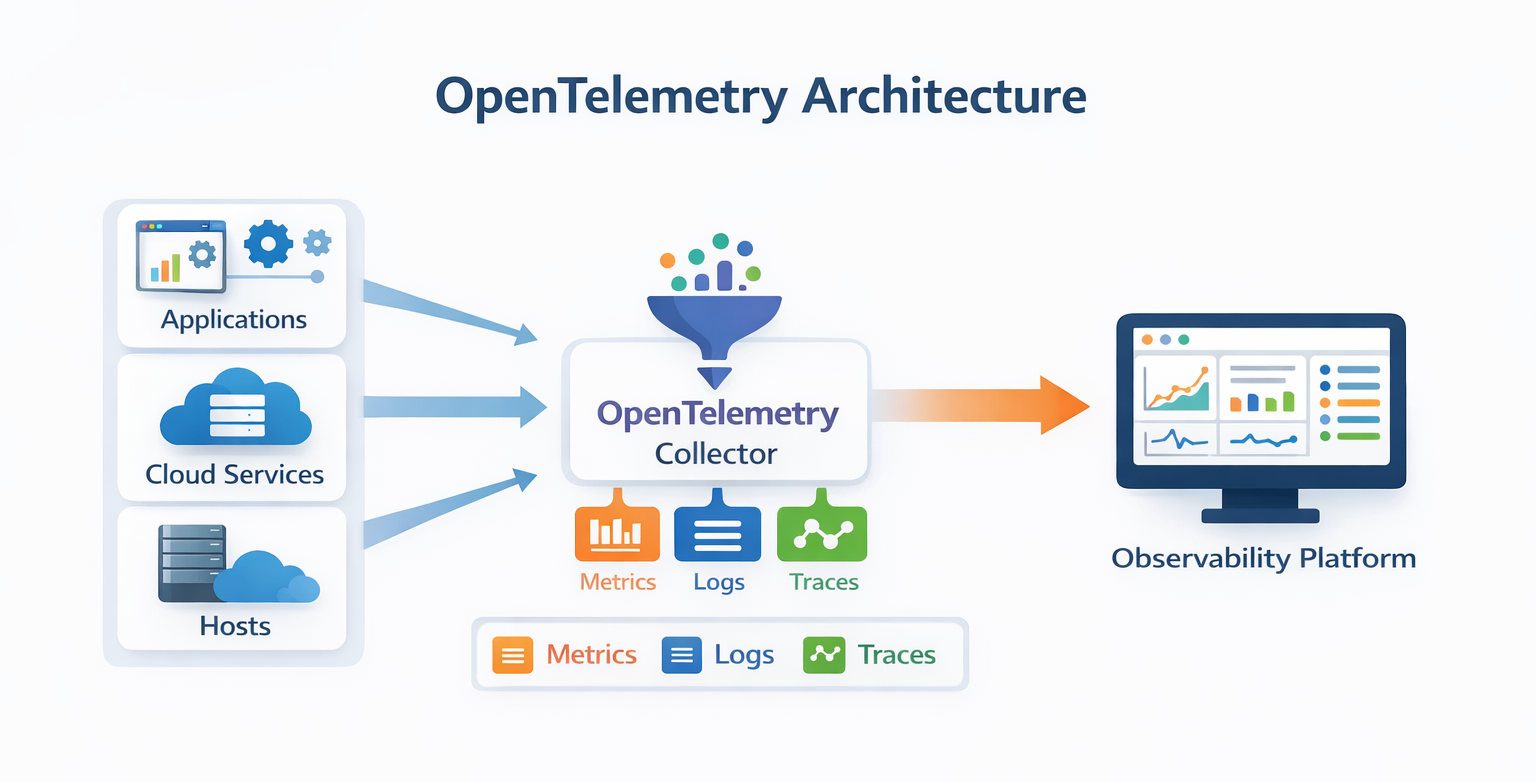
2️⃣ Infrastructure & Platform Monitoring
Infrastructure visibility is foundational.
Leading Enterprise Platforms:
- Datadog
- Dynatrace
- Splunk Observability Cloud
- AppDynamics
What is Monitored:
- Servers (CPU, memory, disk)
- Containers & Kubernetes
- Network devices
- Databases
- Cloud infrastructure
- Autoscaling behavior
Best practice:
Consolidate into one strategic observability platform to reduce tool sprawl.
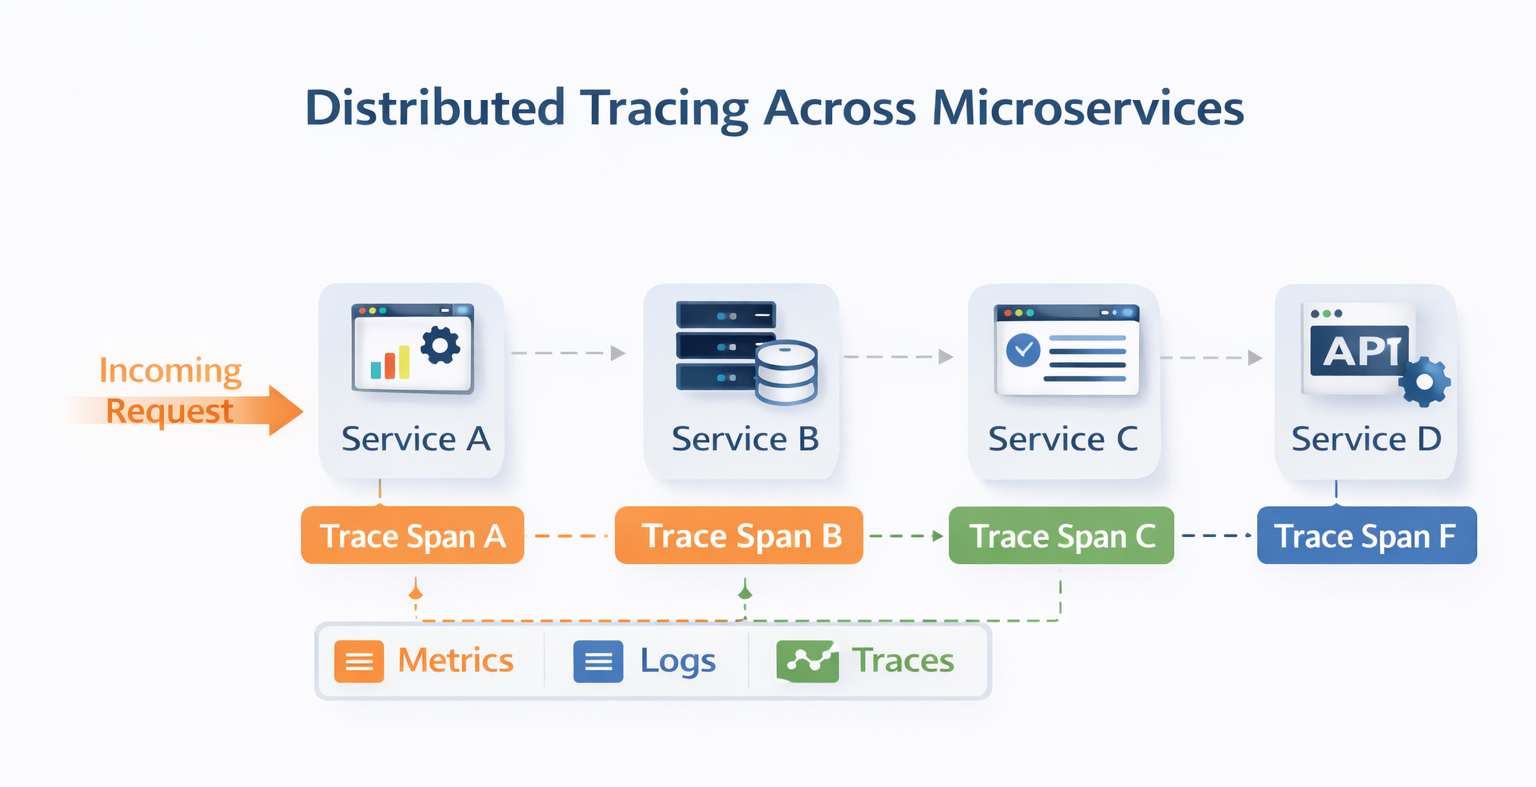
3️⃣ Application Performance Monitoring (APM) & Distributed Tracing
Infrastructure health is not enough.
You must understand:
- API latency
- Microservice dependencies
- Database query performance
- Third-party API impact
Core Capabilities:
- Distributed tracing
- Service maps
- Root cause analysis
- Real User Monitoring (RUM)
- Synthetic monitoring
This enables teams to answer:
Is the problem infrastructure, code, database, or external API?
4️⃣ Centralized Logging & Security Visibility
Metrics tell you something is wrong.
Logs tell you why.
Widely Adopted Platforms:
- Splunk Enterprise
- Elastic Stack
- Microsoft Sentinel
Enterprise Logging Standards:
- Structured logs (JSON)
- Long-term retention policies
- Compliance logging
- Security event integration (SIEM)
Observability and security monitoring increasingly converge.
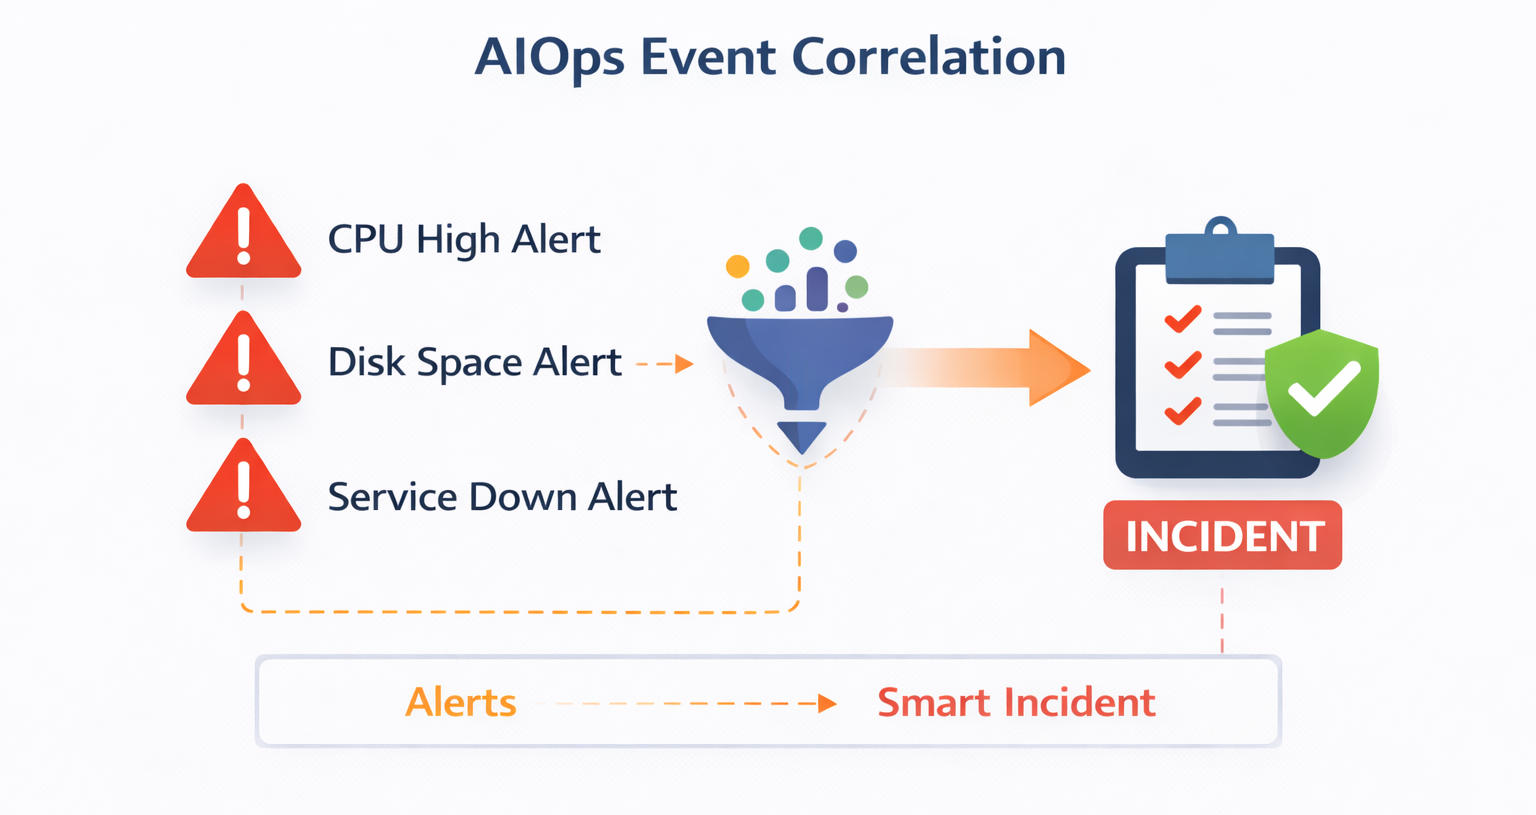
5️⃣ Event Correlation & AIOps (Noise Reduction Layer)
Large environments generate massive alert volumes.
Without correlation:
- Alert fatigue increases
- Teams ignore notifications
- Incidents escalate unnoticed
Enterprise Event Platforms:
- BigPanda
- Moogsoft
- ServiceNow Event Management
What This Layer Does:
- Deduplicates alerts
- Correlates related events
- Applies topology awareness
- Converts thousands of alerts into a single incident
This is where true operational maturity begins.
6️⃣ ITSM Integration & Service Mapping
Monitoring alone is not enough.
Incidents must integrate with structured IT workflows.
Leading ITSM Platforms:
- ServiceNow
- Jira Service Management
Critical Enterprise Components:
- CMDB (Configuration Management Database)
- Business service mapping
- SLA tracking
- Change management integration
Best practice flow:
Alert → Event Correlation → Incident Created → Auto-Assignment → SLA Timer Starts7️⃣ On-Call & Escalation Management
When a high-severity incident occurs:
Immediate action is required.
Common Enterprise Platforms:
- PagerDuty
- Opsgenie
Capabilities:
- Escalation policies
- SMS / Call / App notifications
- Executive alerts
- Incident timeline tracking
This reduces MTTA (Mean Time To Acknowledge).
8️⃣ Dashboards & Business Visibility
Dashboards should serve multiple audiences:
Technical Teams:
- Infrastructure health
- Service performance
- Incident trends
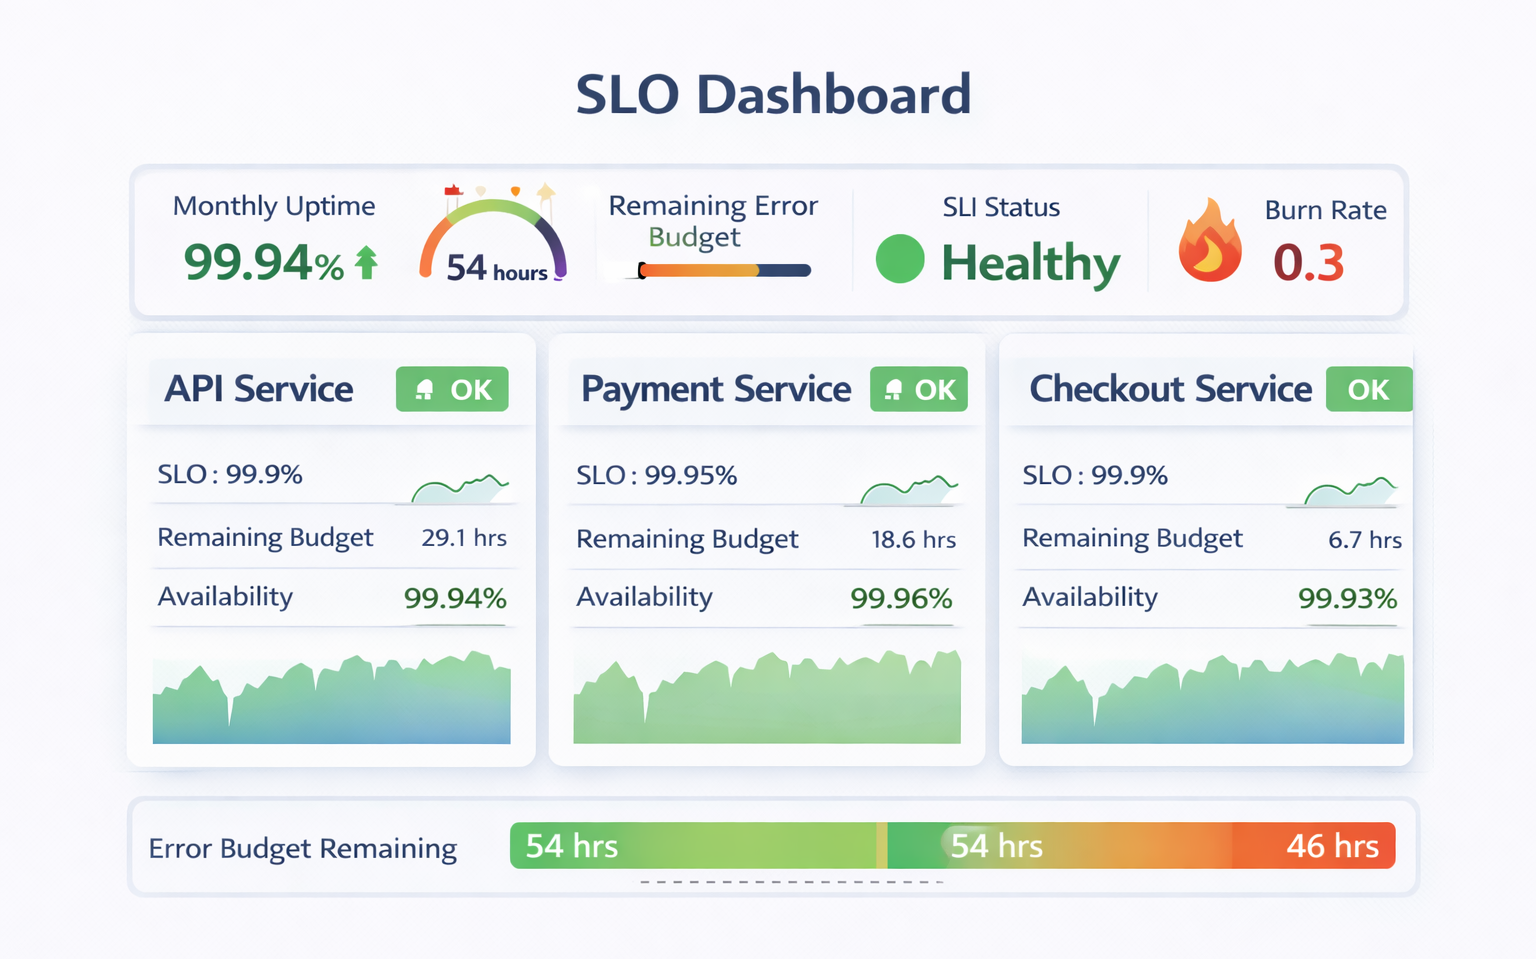
Leadership:
- SLA compliance
- Customer impact
- Error budgets
- Availability metrics
Popular visualization platforms:
- Grafana
- Dynatrace
- Datadog
9️⃣ SLI, SLO & SLA: Reliability Governance
Modern observability aligns with reliability engineering.
SLI (Service Level Indicator)
Measured metric (e.g., request latency < 200ms)
SLO (Service Level Objective)
Target goal (e.g., 99.95% uptime)
SLA (Service Level Agreement)
Formal commitment to customers
Best practice:
- Define SLOs per business service
- Track error budgets
- Link incidents to SLO breaches
- Use reliability data in engineering decisions
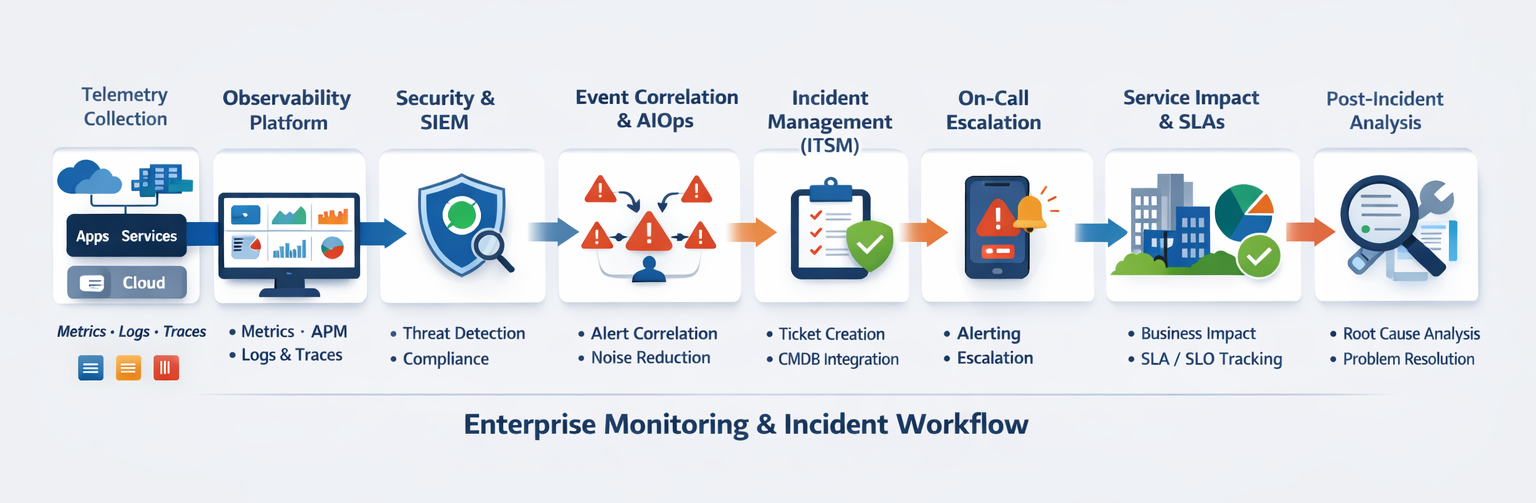
🔟 Complete Enterprise Monitoring Flow
Telemetry (OpenTelemetry)
        ↓
Unified Observability Platform
        ↓
Logs → Central SIEM
        ↓
Event Correlation / AIOps
        ↓
Incident in ITSM
        ↓
On-Call Escalation
        ↓
Business Service Impact Analysis
        ↓
SLA / SLO Reporting
        ↓
Post-Incident Review & Problem Management
Advanced Practices for Mature Organizations
- Observability-as-Code (version-controlled monitoring configs)
- Auto-remediation runbooks
- Synthetic transaction monitoring
- Real User Monitoring (RUM)
- FinOps monitoring (cloud cost observability)
- AI-based anomaly detection
- Chaos engineering testing
- Shift-left monitoring in CI/CD pipelines
Common Mistakes to Avoid
- Too many disconnected tools
- No alert correlation
- No defined SLOs
- Monitoring infrastructure but not business services
- Ignoring post-incident reviews
- Alert fatigue without prioritization
Final Thoughts
A modern enterprise monitoring strategy is not about collecting more data.
It is about:
- Standardizing telemetry
- Reducing noise
- Automating workflows
- Aligning technical health with business impact
- Building a culture of reliability
When done correctly, observability becomes:
Not just an operations function —
but a strategic business capability.
Note: Diagrams and illustrations in this post were created using AI to help visualize complex enterprise monitoring architectures and workflows.